Summary
A high-performance liquid chromatographic (HPLC) method with a reverse phase C8 column measures concentrations of chlorophylls, xanthophyll, and carotenoids in samples of particulate matter from the California Current Ecosystem (CCE). Concentrations of chlorophyll a are used as a proxy for phytoplankton biomass and concentrations of other taxon-specific pigments are used to determine contributions of phytoplankton taxa to total phytoplankton biomass (Wright et al. 1991).
The original description of the method was written Feb. 2010 by R. Goericke and M. Roadman. Revised methods were written in September 2023 by Shonna Dovel and Mike Stukel.
CCE-LTER Sample Collection Overview
HPLC samples are collected on all CalCOFI and SCCOOS (Southern California Coastal Ocean Observing System) static stations located within the CCE. Starting in 2023, sampling only includes Line 90.0, Line 80.0, the Santa Barbara Basin Station, and Primary Productivity noon casts. Samples were collected from two to eight depths in the photic zone while primarily sampling the 10m and Chlorophyll max depth. Additional samples collected on the CCE-LTER Process Cruises sample the photic zone on variable experimental sites and underway monitoring.
Sample Collection
- Samples are drawn from the niskin bottles using 0.5, 1.04 or 2.2 liter brown polypropylene bottles, depending on the chlorophyll concentration measured by the fluorometer on the CTD. For the higher chlorophyll values, typically the coastal stations, less water is sampled.
- Samples (0.5, 1.04, or 2.2 L) are filtered onto 25 mm GF/F filters (Whatman) under a low vacuum pressure (≤ 40 mm Hg).
- Once the sample has finished filtering, the filter is carefully folded in half, and blotted on a paper towel to remove excess water. The folded filter is placed in a labeled 2 ml cryovial and stored in liquid nitrogen for analysis ashore.
Sample Processing History
CCE-LTER HPLC samples collected from both the Process Cruises and CalCOFI cruises were initially processed through the Goericke lab at Scripps Institution of Oceanography, UCSD. Starting in 2022, samples were shipped and processed at the Horn Point Laboratory Analytical Services at the University of Maryland Center of Environmental Science (UMCES).
Cruise years processed by individual laboratories:
High-Performance Liquid Chromatography Pigments (Process Cruise):
https://oceaninformatics.ucsd.edu/datazoo/catalogs/ccelter/datasets/72
Cruises from 2006 through 2021 (Goericke Lab)
Cruises from 2021 to current (UMCES Lab)
*P2107 samples processed in both labs for comparisons
High-Performance Liquid Chromatography Pigments (CalCOFI Cruise):
https://oceaninformatics.ucsd.edu/datazoo/catalogs/ccelter/datasets/316
Cruises from 2002 through 2014 (Goericke Lab)
Cruises from 2014 to current (UMCES Lab)
*201402, 201404, and 201411 samples processed in both labs
*201402 and 201404 samples processed in both labs for comparisons
CCE-LTER incorporated pigments from both labs into one dataset for each cruise type. We recommend that investigators using this data for assessing long-term changes carefully investigate the sensitivity of their results to the change in the laboratory analysis. To help facilitate the changes in laboratory sensitivity, pigment data from both labs have individual field columns, for example:
Total Chlorophyll a (Goericke_SIO) and Total Chlorophyll a (UMCES)
To understand the variability between each pigment processed between the Goericke Lab and UMCES lab, see:
Appendix 1 – Goericke Lab and UMCES intercomparison results
Pigments observed:
Total Chlorophyll a – Processed in both Goericke(SIO) and UMCES Labs
Also referred to as [TChl a], TChla, Total Chl a (Goericke_SIO) or Total Chl a (UMCES)
Goericke and UMCES Calculation: [TChl a] = [Chl a] + [DVChl a] + [Chlide a]
Chlorophyll a – Processed in both Goericke(SIO) and UMCES Labs
Also referred to as [Chl a], Chlorophyll a (Goericke_SIO) or Chlorophyll a (UMCES)
Divinyl Chlorophyll a – Processed in both Goericke(SIO) and UMCES Labs
Also referred to as [DVChl a], Divinyl Chl a, Div Chl a, Divinyl Chlorophyll a (Goericke_SIO) or Divinyl Chlorophyll a (UMCES)
Chlorophyllide a – Processed in both Goericke(SIO) and UMCES Labs
Also referred to as [Chlide a], Chlorophyllide a (Goericke_SIO) or Chlorophyllide a (UMCES)
Total Chlorophyll b – Processed in both Goericke(SIO) and UMCES Labs
Also referred to as [Chl b], TChlB, Total Chlorophyll b (Goericke_SIO) or Total Chlorophyll b (UMCES); Goericke lab – DVChl b was not separated
UMCES Lab Calculation [TChl b] = [Chl b] + [DVChl b]
Chlorophyll b – Processed in both Goericke(SIO) and UMCES Labs
Also referred to as [Chl b], Chlorophyll b (Goericke_SIO) or Chlorophyll b (UMCES)
Divinyl Chlorophyll b – Processed in UMCES Labs
Also referred to as [DVChl b] or Divinyl Chlorophyll b (UMCES)
Total Chlorophyll c – Processed in both Goericke(SIO) and UMCES Labs
Also referred to as [TChl c], TChlC, Total Chlorophyll c (Goericke_SIO) or Total Chlorophyll c (UMCES)
Goericke Lab Calculation [TChl c] = [Chl c] + [Chl c 1] + [Chl c 2] + [Chl c 3]
UMCES Lab Calculation [TChl c] = [Chl c 1,2] + [Chl c 3]
Chlorophyll c – Processed in Goericke(SIO) Lab
Also referred to as [Chl c], or Chlorophyll c (Goericke_SIO)
Chlorophyll c 1 – Processed in Goericke(SIO) Lab
Also referred to as [Chl c 1] or Chlorophyll c 1 (Goericke_SIO)
Chlorophyll c 2 – Processed in Goericke(SIO) Lab
Also referred to as [Chl c 2] or Chlorophyll c 2 (Goericke_SIO)
Chlorophyll c 12 – Processed in UMCES Lab
Also referred to as [Chl c 12] or Chlorophyll c 12 (UMCES)
Chlorophyll c 3 – Processed in both Goericke(SIO) and UMCES Labs
Also referred to as [Chl c 3], Chlorophyll c 3 (Goericke_SIO) or Chlorophyll c 3 (UMCES)
UMCES Lab – may include divinyl and monovinyl forms
Phaeophorbide a– Processed in UMCES Lab
Also referred to as Phaeophorbide a (UMCES)
Pheophytin a– Processed in UMCES Lab
Also referred to as Pheophytin a (UMCES)
Peridinin – Processed in both Goericke(SIO) and UMCES Labs
Also referred to as Peridinin (Goericke_SIO) or Peridinin (UMCES)
19′-butanoyloxyfucoxanthin – Processed in both Goericke(SIO) and UMCES Labs
Also referred to as butanoyloxyfucoxanthin, butfucox, 19′-butanoyloxyfucoxanthin (Goericke_SIO) or 19′-butanoyloxyfucoxanthin (UMCES)
Fucoxanthin – Processed in both Goericke(SIO) and UMCES Labs
Also referred to as fucox, Fucoxanthin (Goericke_SIO) or Fucoxanthin (UMCES)
Neoxanthin – Processed in both Goericke (SIO) and UMCES Labs
Also referred to as neox, Neoxanthin (Goericke_SIO) or Neoxanthin_UMCES
Prasinoxanthin – Processed in both Goericke(SIO) and UMCES Labs
Also referred to as Prasinoxanthin (Goericke_SIO) or Prasinoxanthin (UMCES)
Violaxanthin – Processed in both Goericke(SIO) and UMCES Labs
Also referred to as Violaxanthin (Goericke_SIO) or Violaxanthin (UMCES)
19′-hexanoyloxyfucoxanthin – Processed in both Goericke(SIO) and UMCES Labs
Also referred to as hexanoyloxyfucoxanthin, hexfucox, 19′-hexanoyloxyfucoxanthin (Goericke_SIO) or 19′-hexanoyloxyfucoxanthin (UMCES)
Diadinoxanthin – Processed in both Goericke(SIO) and UMCES Labs
Also referred to as diadinox, Diadinoxanthin (Goericke_SIO) or Diadinoxanthin (UMCES)
Alloxanthin – Processed in both Goericke(SIO) and UMCES Labs
Also referred to as allox, Alloxanthin (Goericke_SIO) or Alloxanthin (UMCES)
Diatoxanthin – Processed in both Goericke(SIO) and UMCES Labs
Also referred to as diatox, Diatoxanthin (Goericke_SIO) or Diatoxanthin (UMCES)
Zeaxanthin – Processed in both Goericke(SIO) and UMCES Labs
Also referred to as zeax, Zeaxanthin (Goericke_SIO) or Zeaxanthin (UMCES)
Lutein – Processed in UMCES Lab
Also referred to as Lutein (UMCES)
Gyroxanthin diester – Processed in UMCES Lab
Also referred to as Gyroxanthin diester (UMCES)
Carotene – Processed in both Goericke(SIO) and UMCES Labs
Also referred to as Carotene (Goericke_SIO) or Carotene (UMCES)
Goericke Lab Calculation Carotene = [ββ-Car]
UMCES Lab Calculation Carotene = [ββ-Car] + [βε-Car]
UMCES Methods
For updated methods, please contact the Horn Point Laboratory Analytical Services located at the University of Maryland Center of Environmental Science, (UMCES).
https://www.umces.edu/analytical-services
Goericke Lab Methods
The following method was developed by the Goericke laboratory. See Sample Processing History for detailed cruise dates utilized by this method.
HPLC Sample Preparation
- A small cooler, with a test tube rack, is filled with ice and the grinding tubes are placed inside.
- The filters are removed from the cryovials and placed individually in a grinding tube. Each sample is extracted in the cold and dark for 30 minutes in 1.6 ml of a canthaxanthin /acetone mixture (~200 µl saturated solution of canthaxanthin in benzene added to ~250 ml acetone).
- After 30 minutes, the grinding tube is placed in a small ice bath and the samples are ground for approximately 15 seconds (with pulses) using a pestle fitted to a power drill. Samples are returned to the cooler and extracted for 30 more minutes. Care must be taken to avoid spillage of the sample (this is a step that should be practiced beforehand).
- Using a standard Pasteur pipette, the sample is removed from the grinding tube and returned to the original cryovial. The cryovials are centrifuged for 5 minutes at medium-high speed, and 300 µl of the supernatant is placed in the autosampler vial.
- The autosampler vials are placed in the autosampler set at 4°C and the remaining sample in the cryovial is returned to the liquid nitrogen dewar for backup analysis.
HPLC Mobile Phase and Gradient
- Two solvents, A and B, are used for the mobile phase in this method. (Zapata et al. 2000). Both are prepared separately, filtered under low pressure through a 47mm GF/F filter (Whatman), and stored in a 4 liter, glass amber bottle.
- Solvent A is a mixture of methanol: acetonitrile: acidic 0.25 M pyridine solution (50:25:25 v:v:v). The aqueous pyridine solution is prepared by adding 10 ml acetic acid and 20 ml of pyridine to 900 ml Milli-Q water in a 1 L volumetric flask and mixed using a magnetic stirrer in the fume hood. The pH is checked and acetic acid added dropwise until the pH reaches 5.0. The flask is brought to 1 L volume and the pH rechecked.
- Solvent B is a mixture of methanol: acetonitrile: acetone (20:60:20).
- Gradient used with a flow rate of 1 ml min-1 (time; solvents, %A, %B): (0; 100, 0), (12; 60, 40), (36; 0, 100), (38; 0, 100), (40, 100, 0).
HPLC Sample analysis
- An Agilient 1200 series standard thermostatted autosampler, fitted with a 900 µl needle and sample loop, is used to prepare the sample prior to injection into the C8 reversed- phase silica column.
- An injector program is used in overlapped injection mode to decrease sample run time.
- The injector program is set up to mix water and the sample to a concentration of 60% acetone. The sample is prepared in the sample loop with segments of water, sample and air alternating to prevent the water and sample to mix until reaching the column to prevent the degradation of chlorophylls. After the injector program is complete, 160 µl of water, 255 µl of sample, and 23 µl of air are injected into the column and the sample gradient (see HPLC Mobile Phase and Gradient 4) begins.
- The canthaxanthin /acetone mixture (same as used to extract the samples) is mixed with water using a needle syringe to dilute the mixture to 85% acetone (300 µl of water and 1.7 ml of the canthaxanthin acetone mixture) and divided between three autosampler vials.
- For each sample run, 100 µl of the standard is injected in triplicate at the beginning, middle and end of the samples.
HPLC Data analysis
After the run is complete, the individual chromatograms are reviewed, checking baselines and peak labels. The peak areas with labels and retention times are exported from Agilent Chemstation.
See Pigments Observed for within the Goericke Lab.
Calculations
To calculate concentrations of pigments per L seawater (CP) the following needs to be known: Instrument response factor K for the pigment P (KP i.e. the units area per µg pigment injected, 1/µg), Area generated by the pigment (AreaP, no dim), the volume of the seawater filtered (VolSW, L), the volume acetone used for the extraction of the sample (VolEx, mL), the actual volume of extract injected on the HPLC column (VolInj, ml).
VolInj is calculated from the area of the canthaxanthin peak in the sample (CSa) and the area of the canthaxanthin peak in the canthaxanthin standard injection (CSt) and the volume canthaxanthin standard injected for the standard run (VolCanth, ml). This is calculated as:
VolInj = CSa / CSt * VolCanth* 0.85; dim (VolInj) = 1 / 1 * mL * 1
The factor of 0.85 corrects for the dilution of the 100% solution of canthaxanthin in acetone with water.
Pigment concentrations (CP) are calculated from:
CP = (AreaP / KP) / (VolSW * (VolExt / VolInj))
dim (CP) = 1 / (1/µg) / (L * (mL/mL)) = µg/L
Quality control
All samples were quality-controlled based on three criteria. The first two criteria were based on quality control criteria used by Peloquin et al. (2013). The third criterion uses the fluorometric chlorophyll measurements that are made on paired samples taken from the same depth on each CTD cast.
- HPLC Total Chlorophyll a <=0. This criterion indicates clear issues with the samples.
- The ratio of log-transformed accessory pigment to log-transformed TChla is more than two standard deviations from the mean relationship found in the Maredat HPLC database (Peloquin et al. 2013). This criterion is based on the relative constancy between the ratio of chlorophyll and accessory pigments across phytoplankton groups and depths. Specifically, samples are flagged as problematic if the log10-transformed total accessory pigment concentration is greater than 0.922×log10(TChla)-0.358 or if the log10-transformed total accessory pigment concentration is less than 0.922×log10(TChla)+0.423. As of early 2023, very few of our samples were flagged by this criterion, suggesting that most of our data is of high quality.
- Ratio of log10-transformed fluorometric TChla to log10-transformed HPLC TChla is more than two standard deviations from the mean relationship. This criterion takes advantage of the fact that we have independent TChlameasurements determined by fluorometry (using the acidification method) for each of our samples. We note, however, that flagged values based on this criterion do not necessarily mean that the HPLC-derived values are incorrect. There are many reasons that fluorometrically-derived estimates of TChla could be inaccurate. The specific criterion applied is to flag samples if the log10-transformed HPLC TChla is greater than 0.901×log10(TChlaFluor)+0.24 or if the log10-transformed HPLC TChla is less than 0.901×log10(TChlaFluor)-0.30. Samples not flagged based on this criterion typically have an agreement between fluorometric TChla and HPLC TChla that is within approximately a factor of 2. By definition, since we are basing this criterion on an agreement within two standard deviations of the relationship for our own data, this criterion flags ~5% of the data.
No data points were removed from the dataset based on the above criterion. Rather the quality flag column is added. 0 = no quality control criteria triggered. 1 = violates QC1, 2 = violates QC2. 3 = violates QC3. See figure below for results of quality control analyses:
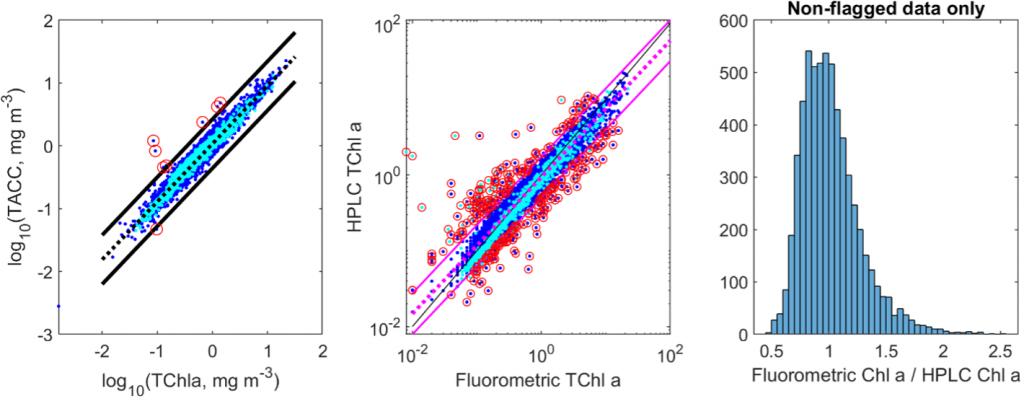
Left panel: QC2, comparison of total accessory pigments to TChla. The dashed line is the log-log regression from the MAREDAT database. Black lines are ± 2 standard deviations. Symbols circled in red are flagged by QC2. Middle panel: QC3, comparison of HPLC-derived TChla to fluorometer-derived TChla. The dashed magenta line is the log-log regression line. Solid magenta lines are ± 2 standard deviations. Symbols circled in red are flagged by QC3. Right panel: Ratio of fluorometric TChla to HPLC Chla for only samples that were not flagged by QC3.
Equipment/Supplies
- 25 mm GF/F filters (Whatman)
- 25 mm filter funnels and bases
- vacuum pump
- 2ml cryovials
- Wheaton Potter-Elvehjem Tissue grinders, 5 ml, and PTFE pestles
- Power drill
- Parafilm
- Pasteur disposable pipet, Fisherbrand
- Centrifuge
- 500 µl needle syringe
- Autosampler vials – National Scientific Target DP RoboVial 9 mm screw thread
- Agilent 1100 Series HPLC (DAD detector, FLD detector, vacuum degasser, quaternary pump, and thermostatted autosampler with 900 µl injection loop and needle)
- Waters Symmetry C8 column (3.5 um particle size, 4.6 x 150 mm, silica, reverse-phase)
- Agilent’s ChemStation for LC software (Rev. B.04.01 SP1)
Reagents
- Liquid Nitrogen
- Acetone, HPLC grade, Fisher Chemical
- Acetonitrile, HPLC grade, Fisher Chemical
- Methanol, HPLC grade, Fisher Chemical
- Acetic acid, glacial, HPLC grade, Fisher Chemical
- Pyridine, Certified ACS, Fisher Chemical
References
- Goericke, R., The Structure of Marine Phytoplankton Communities —Patterns, Rules and Mechanisms. CalCOFI Reports, 52, 182-197, 2011. CCE LTER Contribution #0213.
- Peloquin, J., C. Swan, N. Gruber, M. Vogt , H. Claustre, J. Ras, J. Uitz, R. Barlow, M. Behrenfeld, R. Bidigare, H. Dierssen, G. Ditullio, E. Fernandez, C. Gallienne, S. Gibb, R. Goericke, L. Harding, E. Head, P. Holligan, S. Hooker, D. Karl, M. Landry, R. Letelier, C. A. Llewellyn, M. Lomas, M. Lucas, A. Mannino, J.-C. Marty, B. G. Mitchell, F. Muller-Karger, N. Nelson, C. O’Brien, B. Prezelin, D. Repeta, W. O. Jr. Smith, D. Smythe-Wright, R. Stumpf, A. Subramaniam, K. Suzuki, C. Trees, M. Vernet, N. Wasmund, and S. Wright, The MAREDAT global database of high performance liquid chromatography marine pigment measurements. Earth System Science Data, 5, 109-123, 2013. DOI 10.5194/essd-5-109-2013. CCE LTER Contribution #0244.
- Wright, S.W., S.W. Jeffery, R.F.C. Mantoura, C.A. Llewellyn, T. Bjornland, D. Repeta, and N. Welschmeyer. 1991. Improved HPLC method for the analysis of chlorophylls and carotenoids from marine phytoplankton. Marine Ecology Progress Series 77: 183-196.
- Zapata, M., F. Rodríguez, and J.L. Garrido. 2000. Separation of chlorophylls and carotenoids from marine phytoplankton: a new HPLC method using a reversed phase C-8 column and pyridine-containing mobile phases. Marine Ecology Progress Series 195: 83-102.