The Ocean Institute (OI) Chlorophyll / Temperature Time Series Project is a unique partnership between CCE LTER and OI designed to extend the CCE outreach program and expand the types of coastal temperature and chlorophyll time series collections for site science. This particular project is a cooperative effort engaging trained staff from OI, CCE scientists and research assistants, outreach coordinators, information managers, program analysts and hundreds of K – 12 students. Students and trained staff from OI participate in active scientific field research aboard one of OI’s sampling platforms, the Sea Explorer, a 70-foot floating laboratory. Outfitted with five distinct teaching areas, the Explorer is fully equipped with video microscopes, touch tanks, viewing aquariums, and state-of-the-art electronics. During this floating lab project, students monitor temperature, concentrations of total Chl a and Chl a concentrations larger than 3µm size fraction within the phytoplankton community. Measurements are taken at a depth of 10 m, approximately 2km SSE of the CalCOFI station 90.028. The objective of the OI time series collection is to help characterize the chemical, physical, and biological processes governing the communities of the California Current Ecosystem . Coupled with other biogeochemical measurements monitored in the upper ocean including concentrations of ammonia, dissolved oxygen, dissolved organic carbon, nitrogen and iron, these long-term measurements help scientists understand the processes governing ecosytem variations. Simultaneously, this project acts as a unique test-bed for the development of curricular materials that connect real scientific field work with sound practices in teaching and learning.
Field Data Timeseries
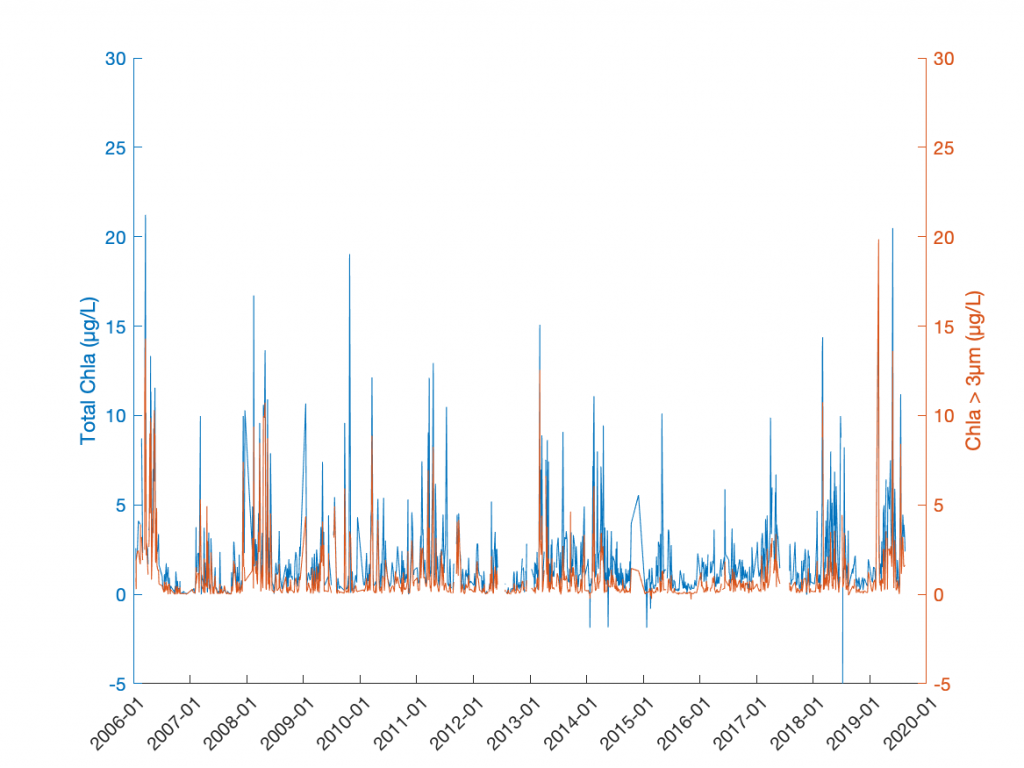
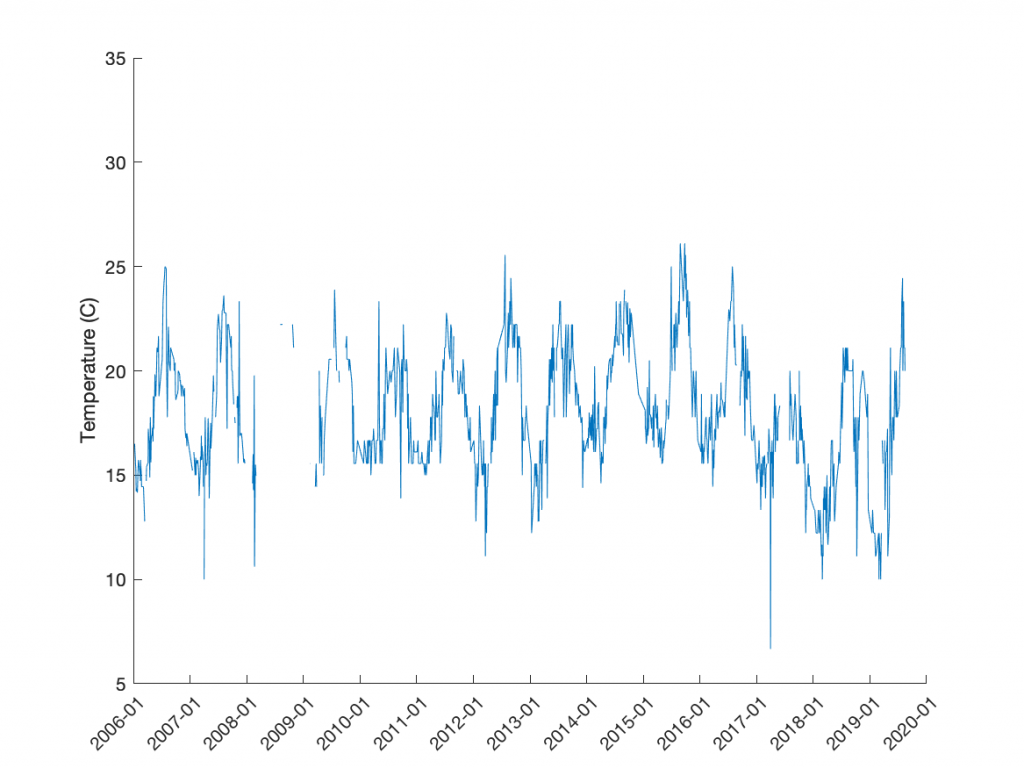
Chlorophyll concentrations and temperature time series, sampled from 10 meters depth in coastal waters (Dana Point, C.A.) from 2006 to current. Dynamic plots update once field data is submitted. Chlorophyll a data is calculated from non quality controlled field data obtained from Ocean Institute Data Collection Event Forms.
Time Series of Chlorophyll a Concentrations in Coastal Waters off Dana Point, California
Time Series of Temperature Sampled, from 10m depth, in Coastal Waters off Dana Point, California
Chlorophyll Concentration Time Series
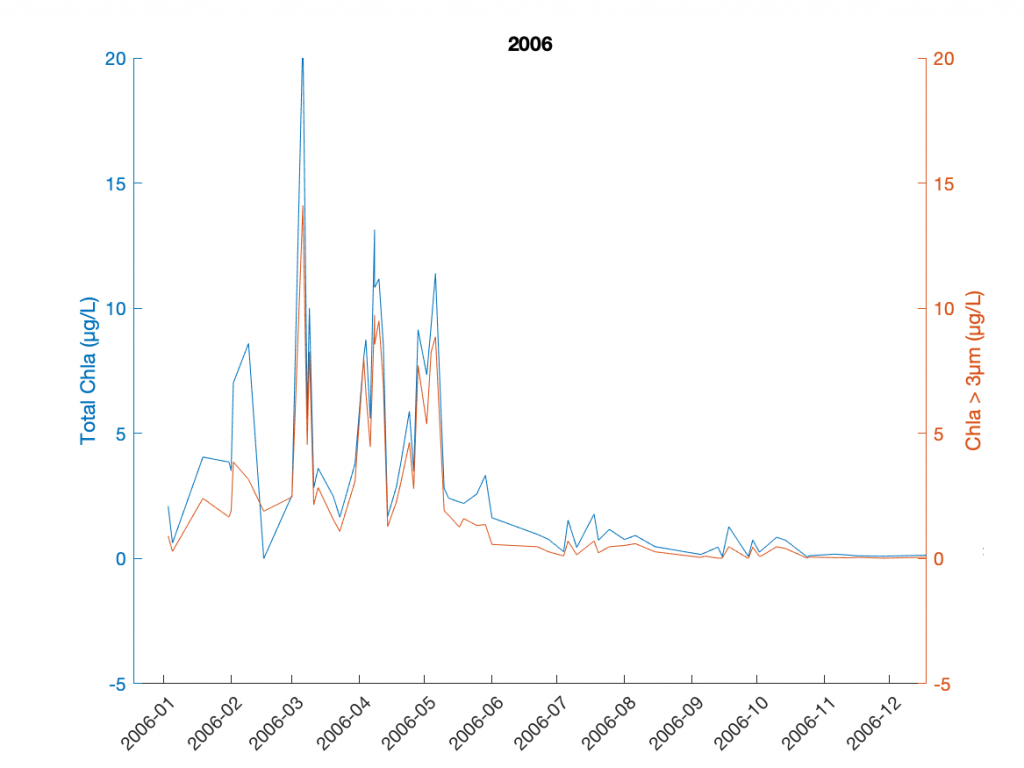
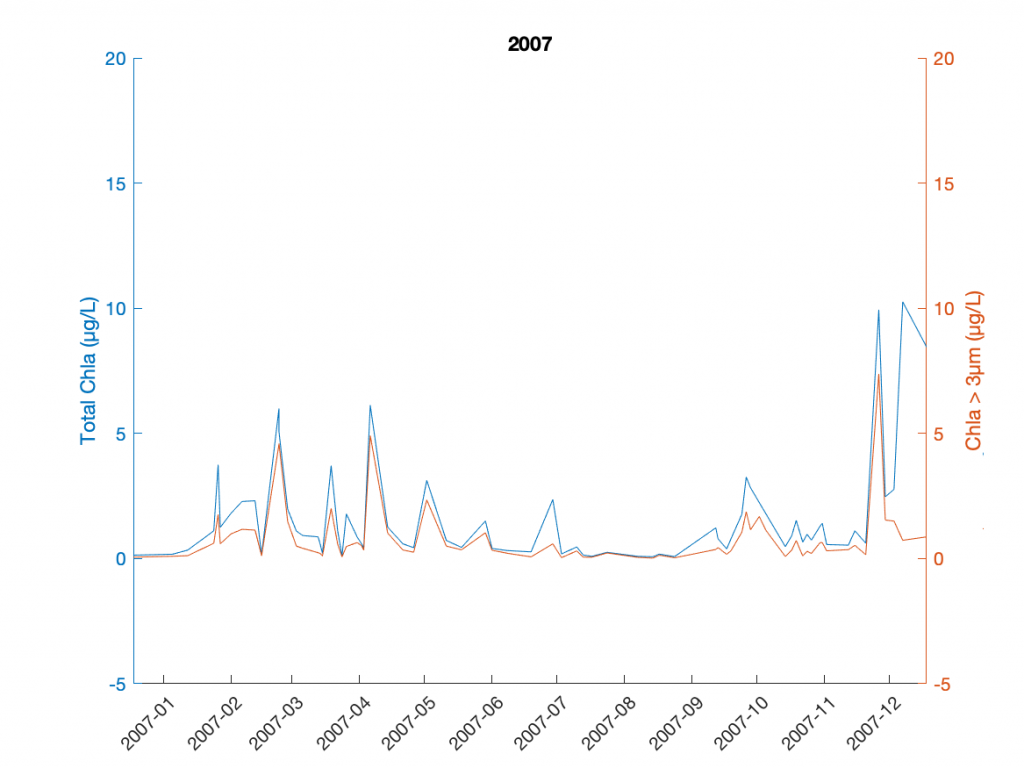
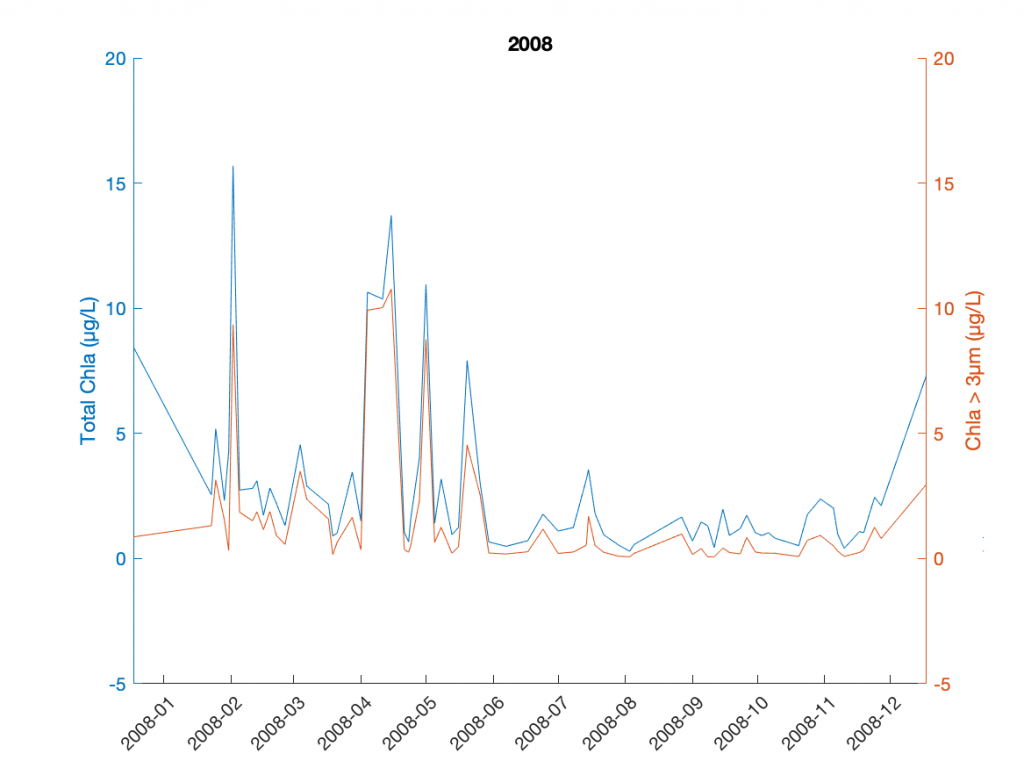
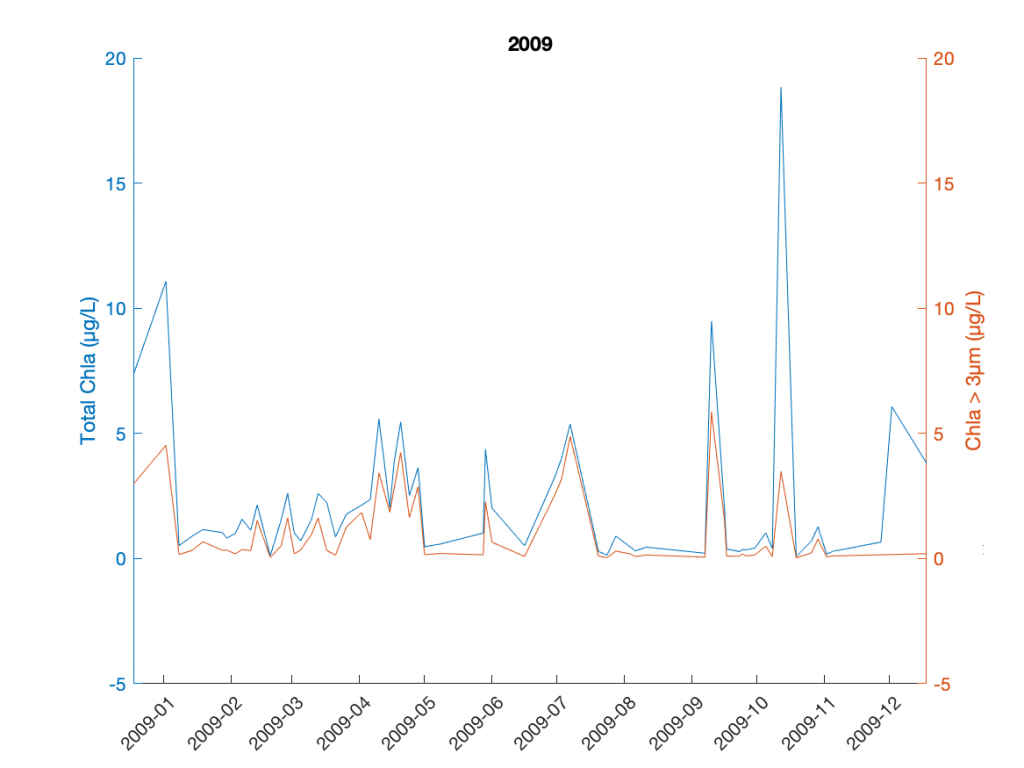
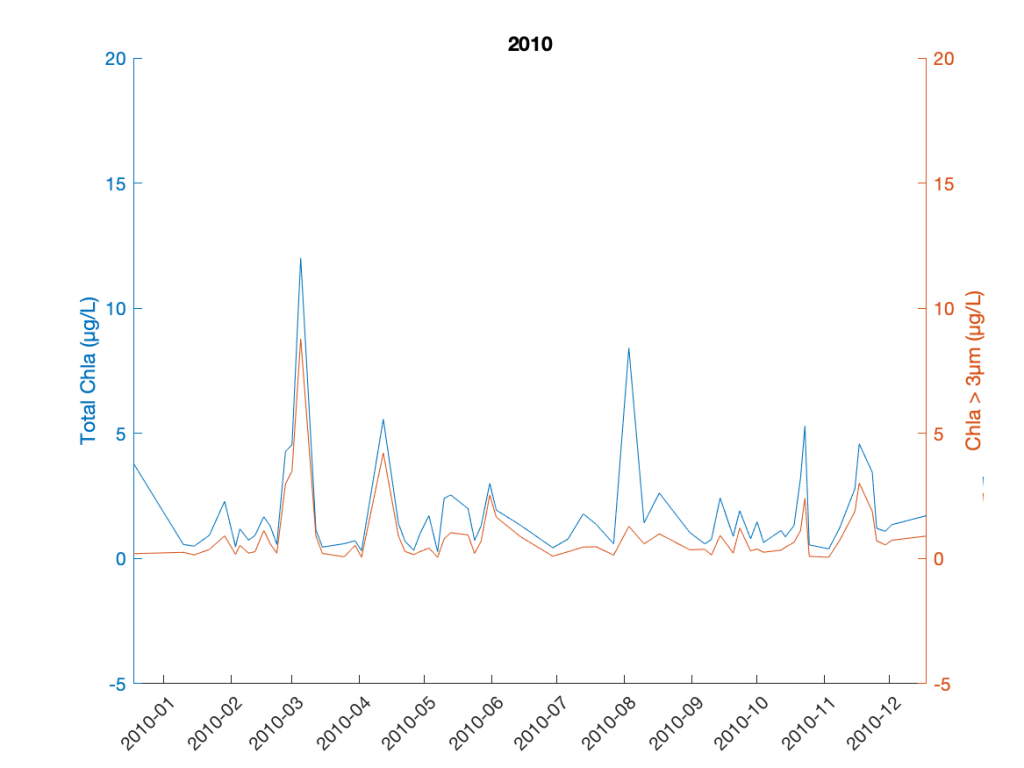
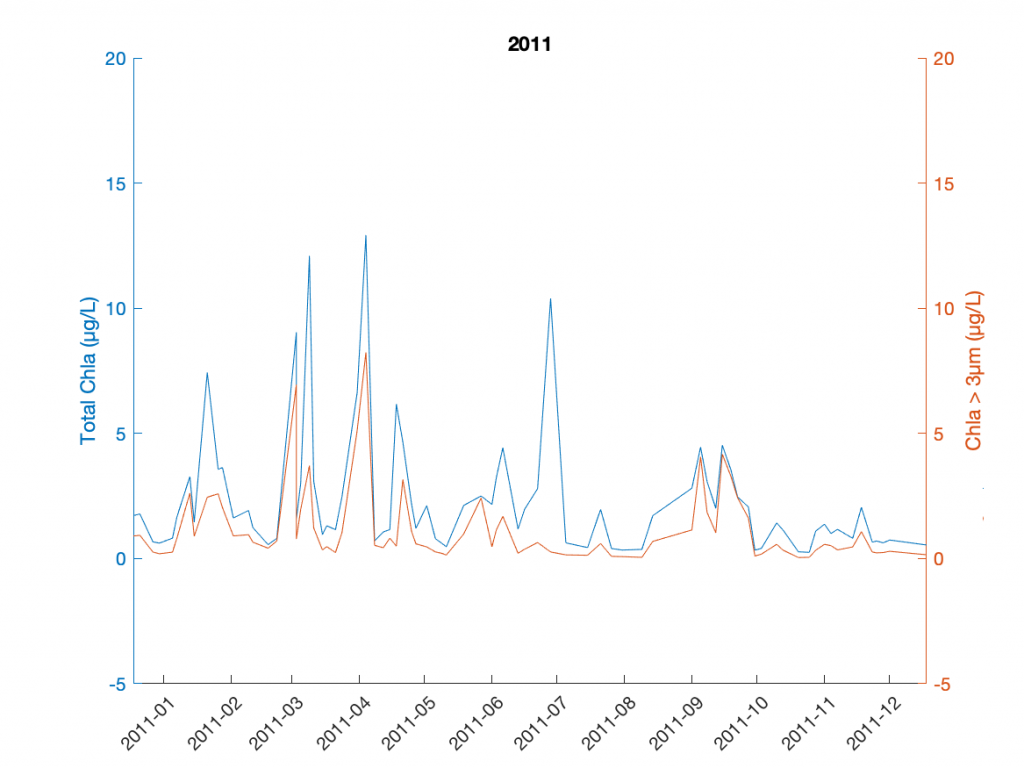
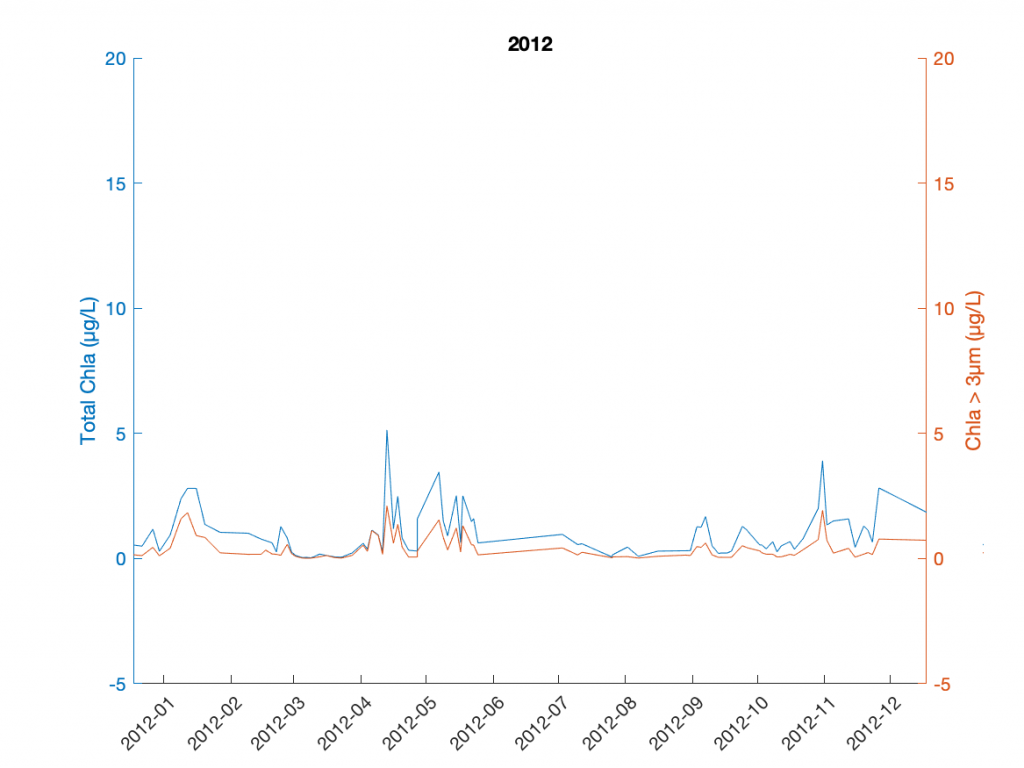
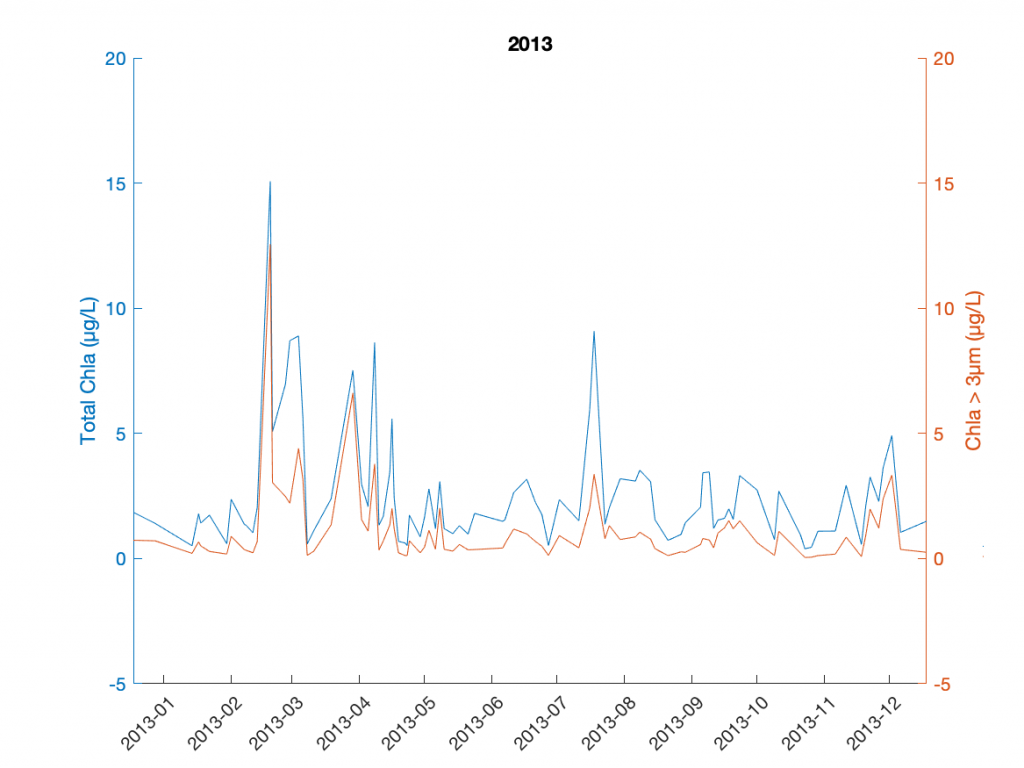
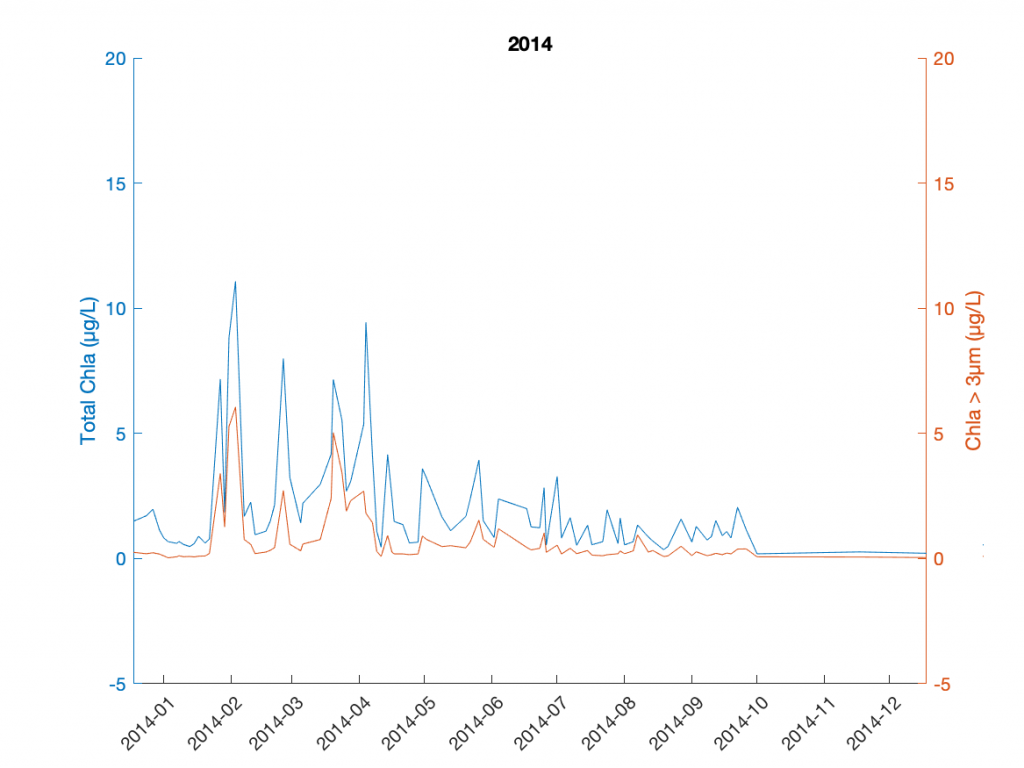
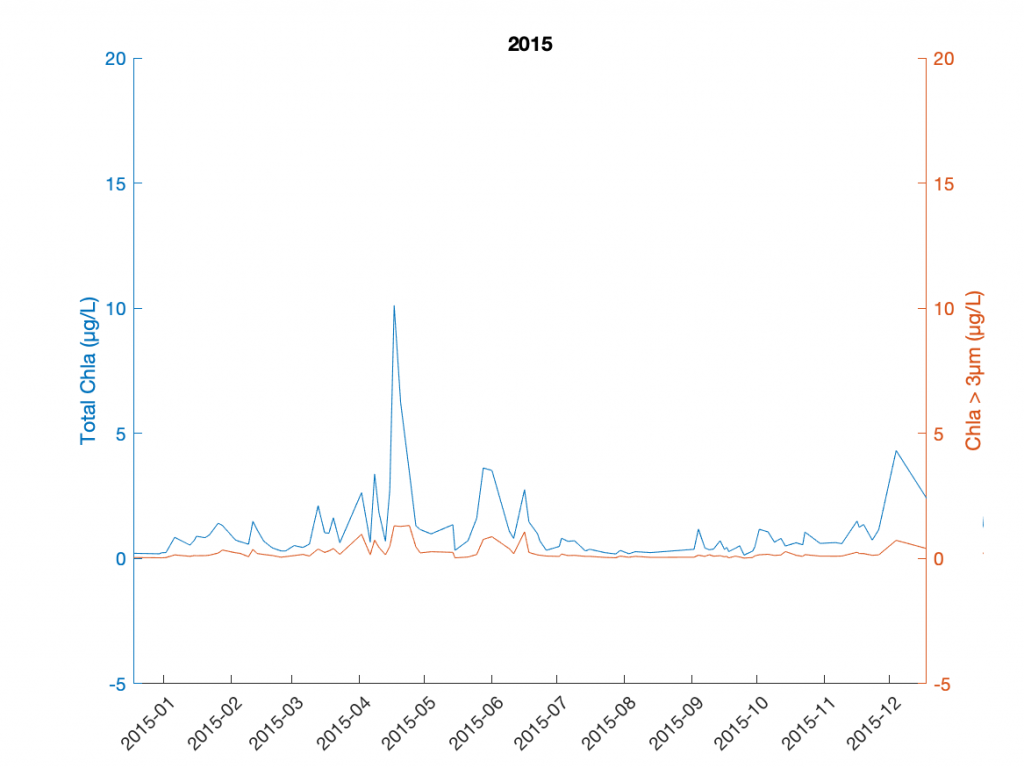
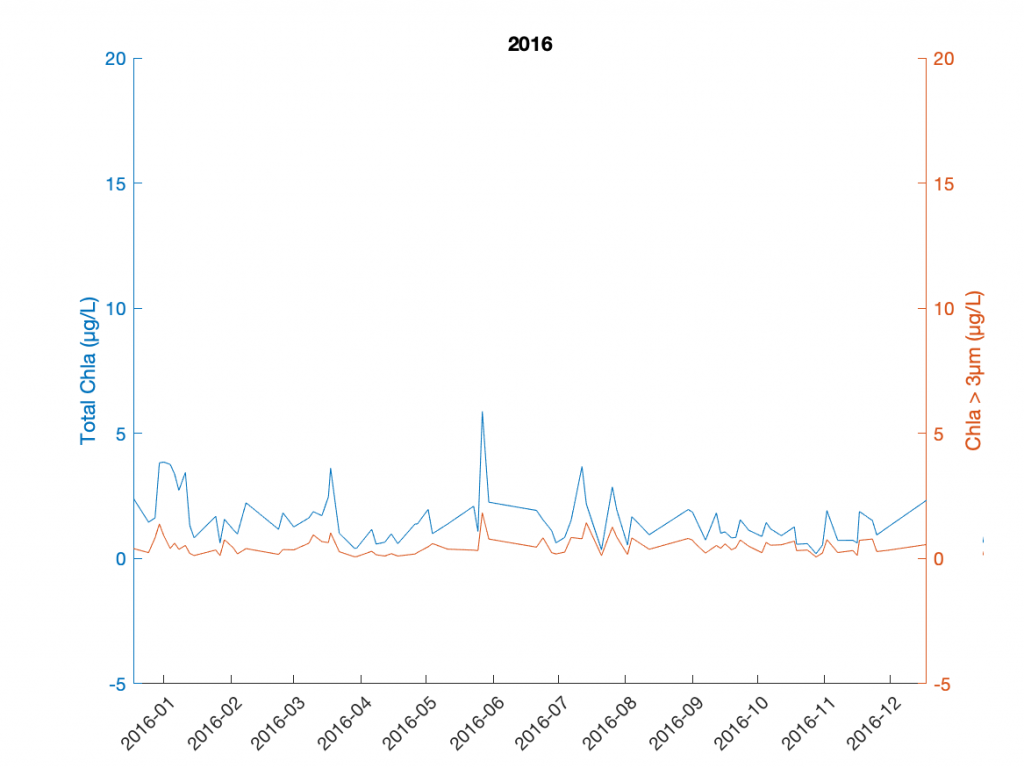
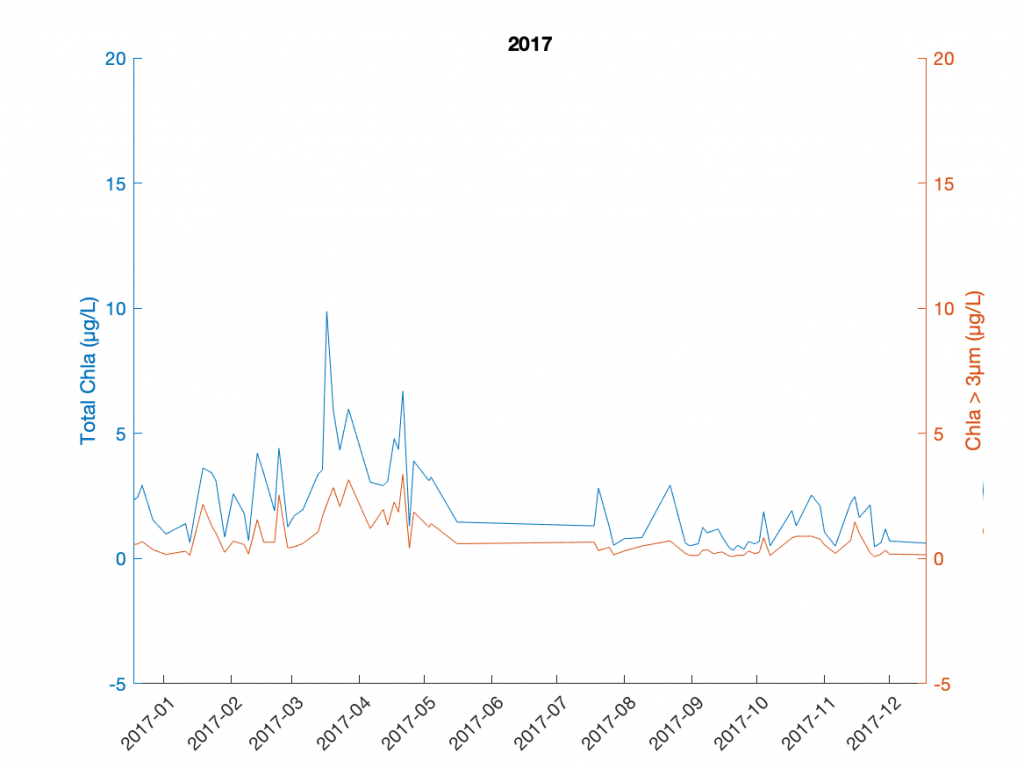
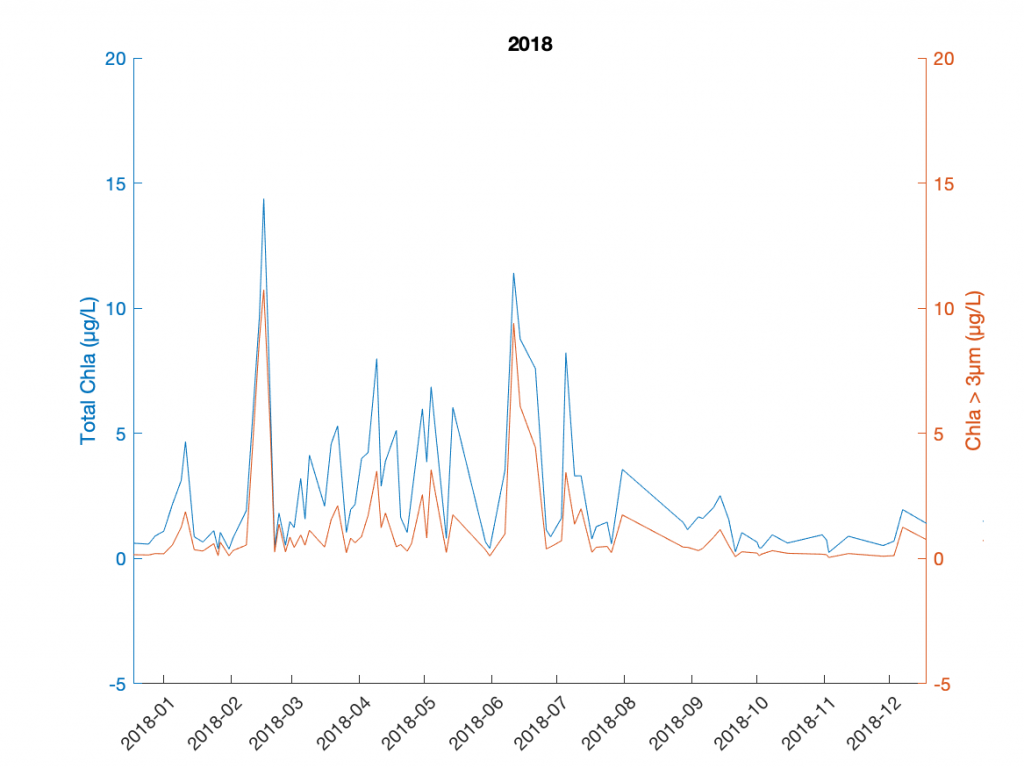
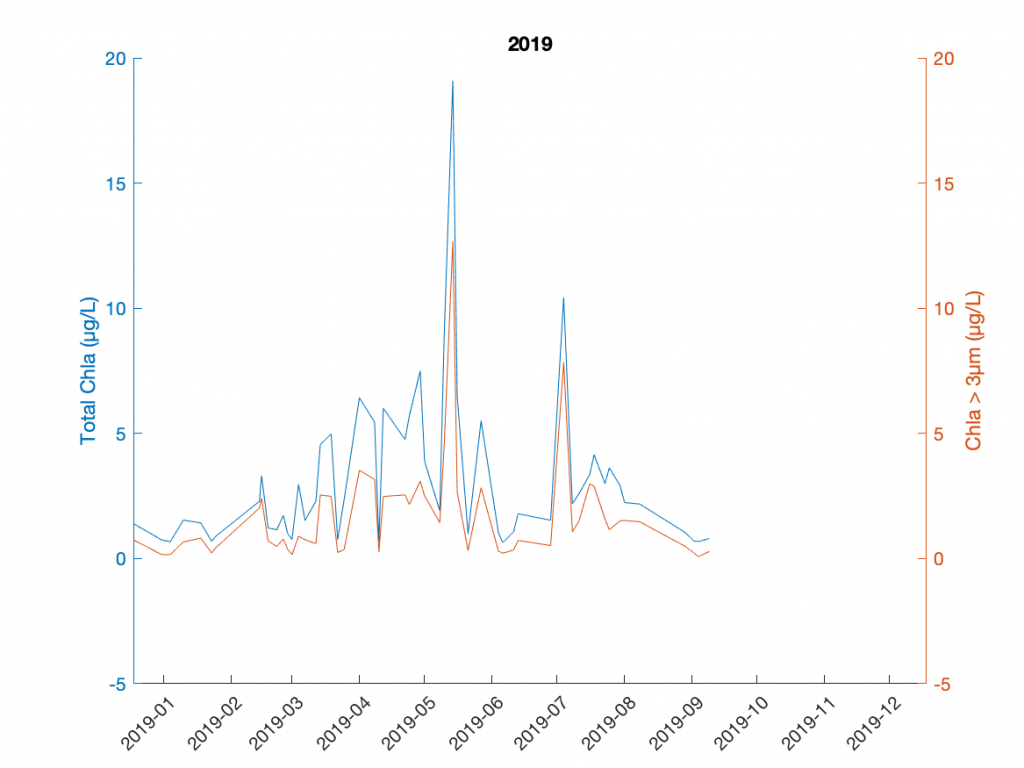
Chlorophyll concentrations sampled from 10 meters depth in coastal waters (Dana Point, C.A.) from 2006 to current. Current year plots are dynamically updated once data is submitted to DataZoo. Quality controlled data is derived from DataZoo – dataset 19: Ocean Institute Chlorophyll – Station Dataset (CCELTER). Since the winter of 2006, measurements at a depth of 10 m have been taken at a station ~ 2 km SSE of CalCOFI station 90.28. The following plots show the time series of chlorophyll a concentrations in coastal waters off Dana Point, California. Plots contain one year of sampling and units are consistent from year to year.
Research QC
Quality controlled data is derived from Ocean Institute Chlorophyll – Station Dataset (CCELTER).
Chla Concentrations in Dana Point, California (2006 to current)
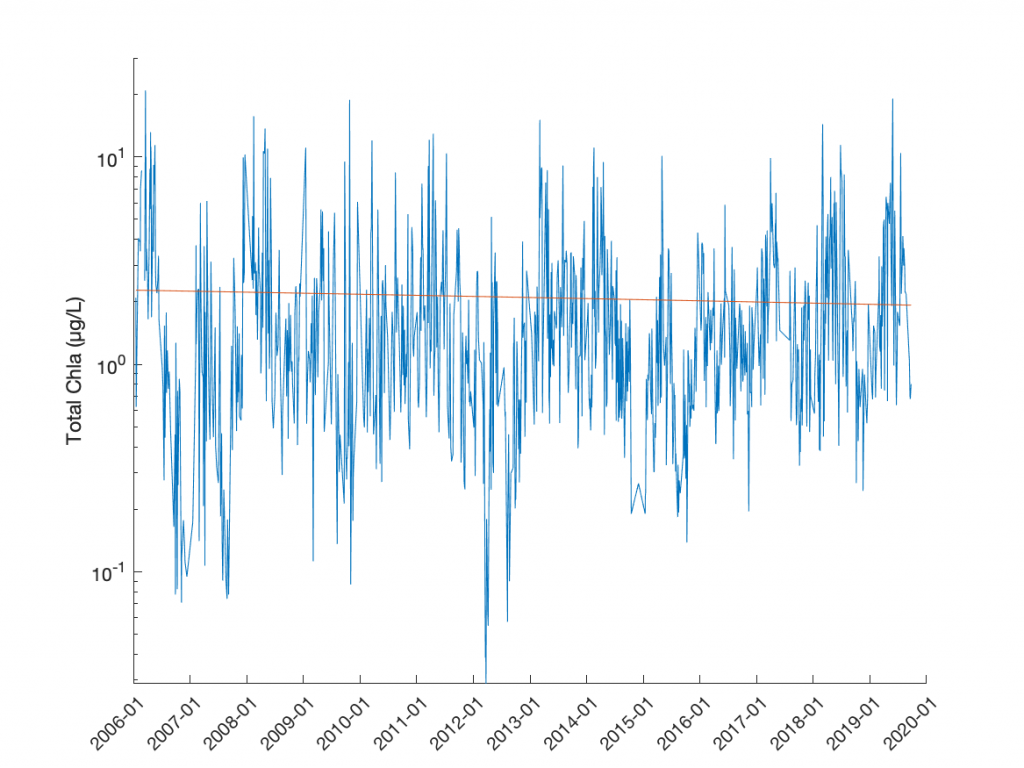
Chla Concentrations in Dana Point, California (2006 to current)
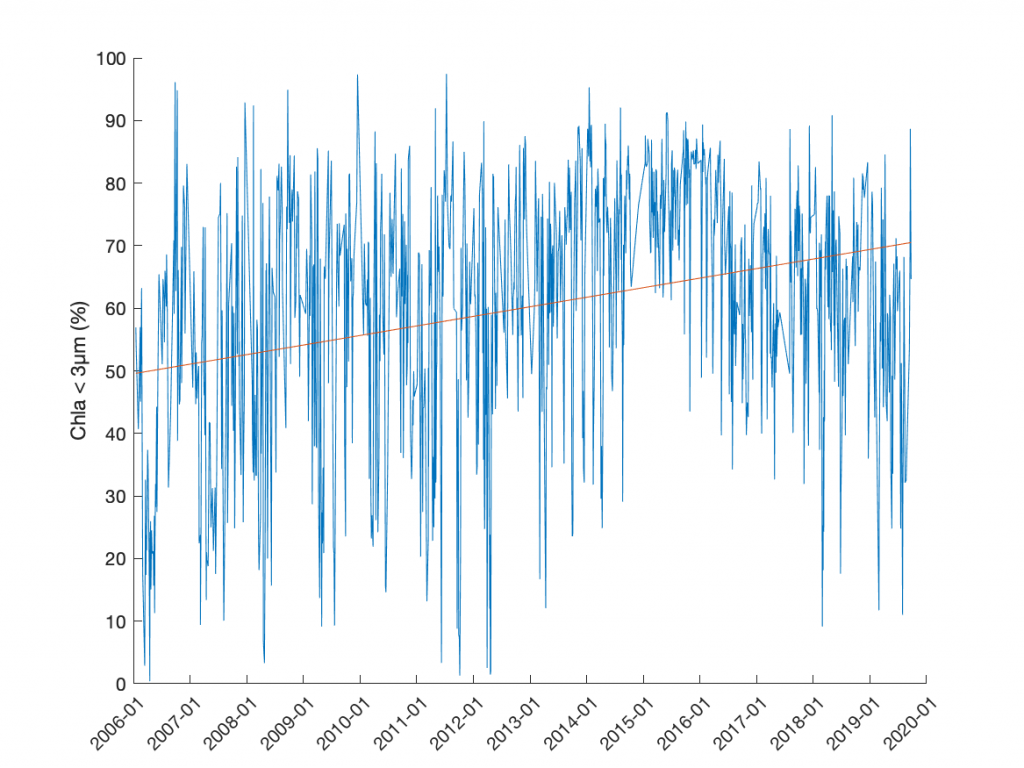
Off Dana Point concentrations of Chl a changed by about an order of magnitude over the last two years, showing a characteristic spring bloom and declining Chl a for the rest of the year. About 48 % of the phyto-plankton are in the pico plankton size class.